What is the carbon footprint of a salmonid egg?
For the first time, the carbon footprint for eggs from farmed salmon and rainbow trout has been calculated, using a life cycle assessment analysis (LCA analysis).
The carbon footprint, or climate footprint, of a fertilized egg has been calculated to 0.028 kg CO2 equivalents, which is less than 0.1% of the carbon footprint of a Norwegian farmed salmon at harvest. This is a very good result. The genetic properties of the egg itself also contribute to reducing the carbon footprint of the fish farmers.
Cradle-to-gate analysis
AquaGen hired Asplan Viak AS to calculate the footprint through a “cradle-to-gate” analysis. The analysis covers the egg’s entire life cycle, from extraction of input raw materials until the egg is ready for sale to the aquaculture industry. The calculation is based on egg production at our facilities in Heim municipality, which includes both a land-based fish farming facility (harvesting of eggs and milt from broodstock fish and production of smolt of the next generation) and marine facilities (the smolt grows into harvestable fish and new broodstock fish), see figure 1.
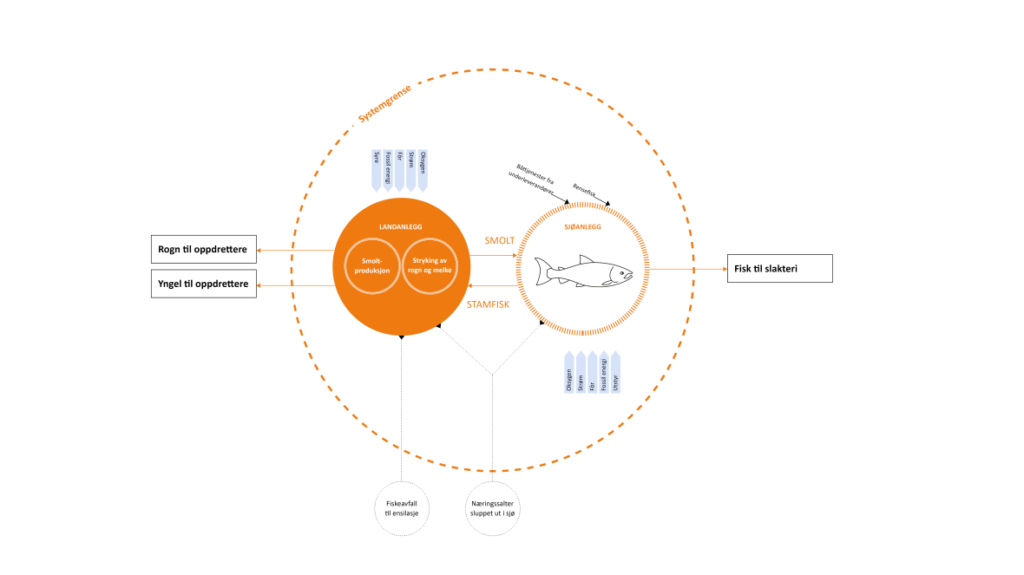
Figure 1: System boundary and activities included in the LCA analysis. The blue arrows are input factors, the two circles represent the production facilities needed in the production of eggs, dashed circles outside the system boundary are products that have not yet been included in the analysis.
Table 1 shows that the carbon footprint of an egg is very low compared to a typical salmon ready for harvest. Actually, less than 0.1% with value allocation, or economic allocation. Allocation indicates how the total carbon footprint is distributed between different products, such as eggs, juveniles, fish for harvest and broodstock fish. The carbon footprint based on value allocation is most commonly used, but mass allocation can also be used – then the carbon footprint for salmonid eggs is reduced by 99% compared to value allocation (see table 1).
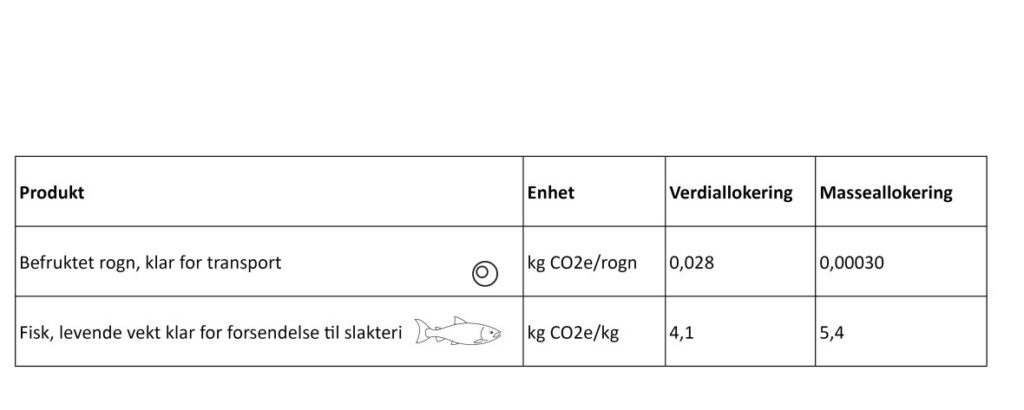
Table 1: Calculated carbon footprints for two AquaGen products. The results are presented as value and mass allocation, as is common for processes with several products.
During the production of broodstock fish, AquaGen sorts out fish that cannot become parents of the next generation. These are sent to the harvesting plant and have a carbon footprint equivalent to that of an average Norwegian farmed salmon (Ziegler et al. 2021). According to Poore and Nemecek (2018), the greenhouse gas emission per produced kilogram of edible protein from farmed fish is similar to that of poultry, but lower than for other protein sources; approx. 80% of the emissions for pigs, approx. 35% of the emissions for cattle from dairy herds and approx. 10% of the emissions for cattle from beef herds.
The LCA analysis pointed to feed and energy use as the most important greenhouse gas sources, see figure 2. The contribution from the feed is a combination of the feed’s carbon footprint, feed utilization and fish mortality. The two latter factors are strongly influenced by the properties inherent in the genetics inside the egg, but the genetic aspects are not currently included in the LCA analysis. Energy use is linked to fuel and electricity used in the farming facilities and by the vessels used in farming and transporting the fish.
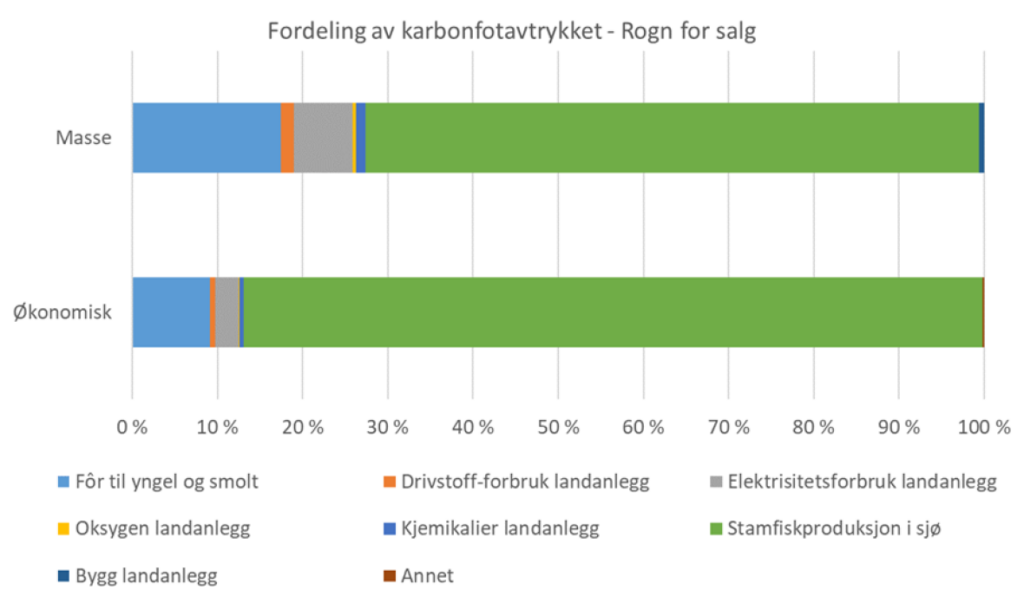
Figure 2: The distribution of the carbon footprint for fertilized eggs with mass or value (economic) allocation.
Continuous reduction of greenhouse gas emissions from our production
At AquaGen, we continuously work to reduce our carbon footprint. In recent years, we have electrified all our marine facilities, improved the energy efficiency of our land facilities and we buy only electricity from renewable sources. In addition, we work steadily to improve biological factors that affect greenhouse gas emissions in our production. For example, we have improved feed utilization by using video-based feeding, and we keep fish mortality low through systematic, preventive work towards diseases, parasites and unnecessary handling. At the same time, we can always improve. In the coming years, we are likely to recycle the water at all our land-based facilities, produce renewable energy locally and replace all fossil fuels with renewable energy sources. In addition, we will further improve the fish’s biological performance, the very core of our breeding work.
Genetic selection reduces the fish’s carbon footprint
We have shown that the carbon footprint of an egg is very small compared to that of a salmon ready for harvest. In addition, the egg itself contributes to reducing the greenhouse gas emissions from production at the fish farmers. AquaGen eggs are specially selected for a high growth rate and a reduced feed conversion rate in the fish. A lower feed conversion rate means less greenhouse gas emissions from the feed. A high growth rate means a high turnover rate throughout the production. The shortened production time reduces the time the fish are exposed to sea lice during the grow-out phase in the sea and ensures efficient utilization of fixed installations such as boats, cages, feed rafts and moorings. In addition, the eggs are selected for increased resistance to diseases that cause mortality and reduced growth. This facilitates good fish welfare, survival, resource utilization and efficiency throughout the entire production cycle.
All in all, the genetic basis for the fish’s biological performance has a great influence on the carbon footprint.
References
Poore J. and Nemecek T. (2018). Reducing food’s environmental impacts through producers and consumers. Science 360 (6392), 987-992. DOI: 10.1126/science.aaq0216
Ziegler F., Jafarzadeh S., Skontorp Hognes E. and Winther U. (2021). Greenhouse gas emissions of Norwegian seafoods: from comprehensive to simplified assessment. J. Industrial Ecology 2021:1-12. DOI: 10.1111/jiec.13150